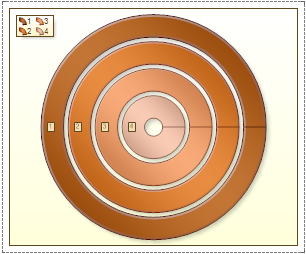
Doughnut chart is circular chart divided into sectors. It has a blank center and the ability to support multiple statistics as one. Doughnut illustrates proportion. On the picture below the doughnut chart sample is represented:
|
Doughnut |
Top Previous Next |
|
Doughnut chart is circular chart divided into sectors. It has a blank center and the ability to support multiple statistics as one. Doughnut illustrates proportion. On the picture below the doughnut chart sample is represented:
|
| Converted from CHM to HTML with chm2web Pro 2.85 (unicode) |