Column Area
Data that is arranged in columns or rows. Column charts are useful for showing data changes over a period of time or for illustrating comparisons among items:
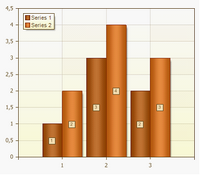
Clustered Column
Clustered column charts compare values across categories.
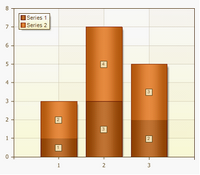
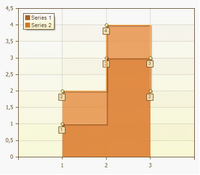
Stacked Column
Stacked column charts show the relationship of individual items to the whole, comparing the contribution of each value to a total across categories.
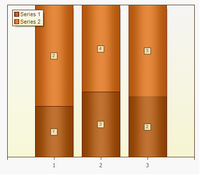
Full-Stacked Column
Full-Stacked column allows comparing the percentage of each value.
Bar Area
Data that is arranged in columns or rows on a worksheet can be plotted in a bar chart. Bar charts illustrate comparisons among individual items. Bar Area should be used if:
| · | Ticks are long. |
| · | If a values show duration. |
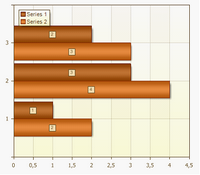
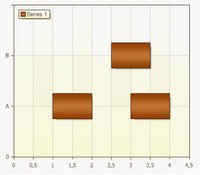
Clustered Bar
Clustered bar charts compares values across categories. In a clustered bar chart, the categories are typically organized along the vertical axis, and the values along the horizontal axis.
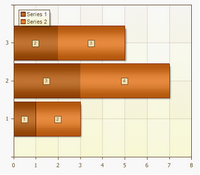
Stacked Bar
Stacked bar charts show the relationship of individual items to the whole.
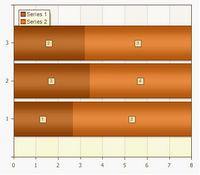
Full-Stacked Bar
This type of charts allows comparing percentage of each value with the total inside the category.
Pie Area
Data that is arranged in one column or row only on a worksheet can be plotted in a pie chart. In a pie chart, the arc length of each sector, is proportional to the quantity it represents. Together, the sectors create a full disk.
Pie charts should be used if:
| · | It is required to show one row of data; |
| · | All values are positive and greater than 0; |
| · | A values belongs to no more than 7 categories; |
| · | Categories corresponds to some parts of the whole chart disk. |
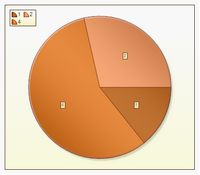
Pie
Pie charts display the contribution of each value to a total. It is possible to manually pull out the slices of a pie chart to emphasize them.
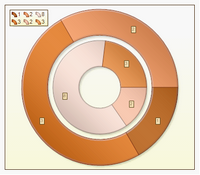
Doughnut
A doughnut chart is functionally similar to a pie chart, with the exception of a blank center and the ability to support multiple statistics as one.
Line Area
Data that is arranged in columns or rows on a worksheet can be plotted in a line chart. Line charts can display continuous data over time, set against a common scale, and are therefore ideal for showing trends in data at equal intervals.
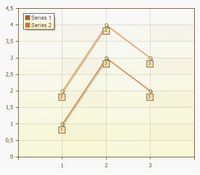
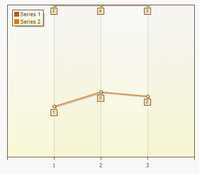
Line
Line and line with markers are used to indicate individual data values, line charts are useful to show trends over time or ordered categories, especially when there are many data points and the order in which they are presented is important.
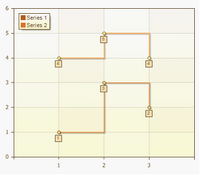
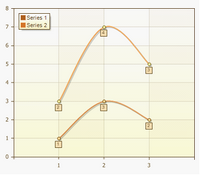
Stepped Line
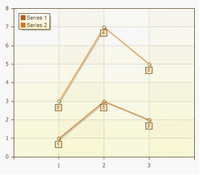
Stacked Line
Displayed with or without markers to indicate individual data values, stacked line charts are useful to show the trend of the contribution of each value over time or ordered categories. If there are many categories or the values are approximate, you should use a stacked line chart without markers.
Full-Stacked Line
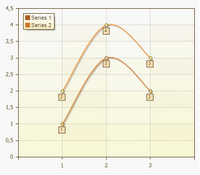
Spline Area
Spline
Stacked Spline
Full-Stacked Spline
Area
Data that is arranged in columns or rows on a worksheet can be plotted in an area chart. Area charts illustrate changes depending on time period and can be used to attract attention to summary value in compliance with trend. For example, data which shows profit depending on time can be created in Area charts to attract attention to total profit.
Area
Area charts display the trend of values over time or categories.

Stepped Area
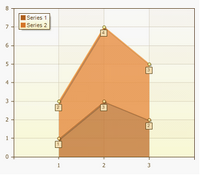
Stacked Area
Stacked area charts display the trend of the contribution of each value over time or categories.
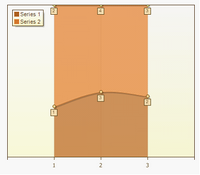
Full-Stacked Area
Full-Stacked Area charts display the trend of the percentage each value contributes over time or categories.

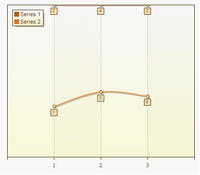
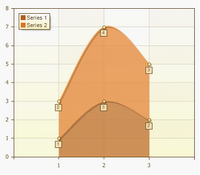
Spline Area
Spline Area
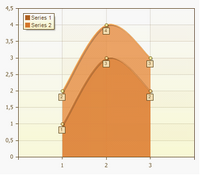
Stacked Spline Area
Full-Stacked Spline Area
Gantt Area
A Gantt chart is a type of bar chart that illustrates a project schedule.
Gantt
Gantt charts illustrate the start and finish dates of the terminal elements and summary elements of a project.
Scatter Area
Data that is arranged in columns and rows on a worksheet can be plotted in an xy (scatter) chart. Scatter charts show the relationships among the numeric values in several data series, or plots two groups of numbers as one series of xy coordinates.
A scatter chart has two value axes, showing one set of numerical data along the horizontal axis (x-axis) and another along the vertical axis (y-axis). It combines these values into single data points and displays them in uneven intervals, or clusters. Scatter charts are commonly used for displaying and comparing numeric values, such as scientific, statistical, and engineering data.
Scatter charts should be used if:
| · | It is required to change the scale of the horizontal axis; |
| · | Values for horizontal axis are not evenly spaced; |
| · | There are many data points on the horizontal axis; |
| · | It is required to show similarities between large sets of data instead of differences between data points; |
| · | It is required to compare large numbers of data points without regard to time - the more data that you include in a scatter chart, the better the comparisons that you can make. |
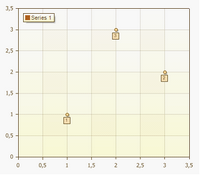
Scatter
This type of chart compares pairs of values. Use a scatter chart without lines when you have data in a specific order.
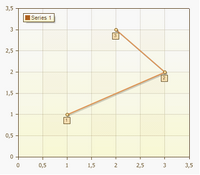
Scatter Line
This type of chart can be displayed with or without straight connecting lines between data points. These lines can be displayed with or without markers.
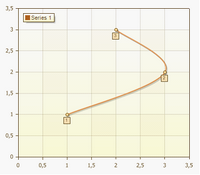
Scatter Spline
This type of chart can be displayed with or without a smooth curve connecting the data points. These lines can be displayed with or without markers. Use the scatter chart without markers if there are many data points.